
Monitoring a status of active archives
The Archive tab provides statistics about active archives, storage allocation, storage size, storage overage, and more. This statistical data can be exported for analysis or reporting purposes.
Each day, when the Archive dashboard is used to gather statistics for a specified duration, the application fetches only the initial call of the day to query Elasticsearch for data regarding each date-groupID-period combination. This data is then stored in a database. Subsequent calls for the same day retrieve data directly from the database, thereby enhancing the performance of the Archive Dashboard.
To monitor a status of active archives and export its statistical report
-
In the left navigation pane, click Dashboardand select theArchive tab.
-
In the top-right corner of the page, select the duration for which you want to view the archiving statistics.
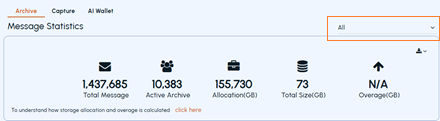
By default, message statistics duration is set to All, and display theOveragedetails. Upon selecting other predefined durations, the application hides theOverage details.
The following statistical data is displayed numerically and graphically. To view the message count in numbers and the corresponding percentage ratio, hover over the colored area of the chart.
Note: Refer to a sample image of theArchive tabcomponents for better visual reference.
| Message Statistics |
|---|
| Total Messages |
| Active Archive |
| Allocation(GB) |
| Total Size |
| Overage(GB) |
| Distribution By Attachment |
| Count By Message Size |
| Distribution By Message Format Type |
| Count By Direction Type |
| Storage Consumption By Age |
| Active Archives Over 12 Months |
| Total Size Over 12 Months (in GB) |
| Top Mail Accounts (For Emails only) |
-
Click the Export icon to export the report in Excel, PDF, CSV, or Word format.
Related information