
Monitoring consumption across Blended Meter components
The Consumption tab on the Management Console > Dashboard provides real-time visibility into usage across the Blended Meter components and how that usage draws against the consumption entitlement for the active subscription term.
The Blended Meter includes the following consumption components:
-
Users
-
Storage
-
New Messages
-
AI Tokens
-
Voice Transcription
-
Export Size
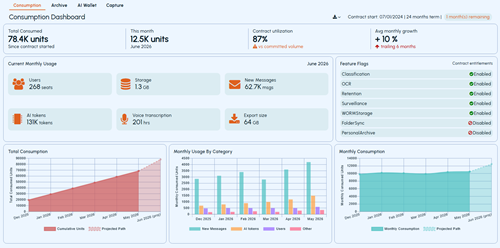
The page displays several sections (numerical and graphical representation of data). Refer to the sample images below.
-
Download icon: Lets you download the available consumption-specific report to Excel, PDF, CSV, and MS Word format.

-
Contract summary: Displays the contract start date, contract duration, and the remaining contract period. Refer to the sample screenshot above.
-
Consumption summary: Provides a high-level view of consumption for the current contract term.

Field Description Total Consumed Displays the total number of consumption units recorded since the contract term started. This month Displays the number of consumption units recorded during the current month. The month and year appear below the value. Contract utilization Displays the percentage of the committed volume that has been consumed during the current contract term. A warning indicator appears when utilization requires attention. Avg monthly growth Displays the average month-over-month growth in consumption over the trailing six-month period. An upward indicator shows an increase in consumption. -
Current Monthly Usage summary: Displays usage recorded for each Blended Meter component during the selected month. The month and year appear in the upper-right corner of the section.
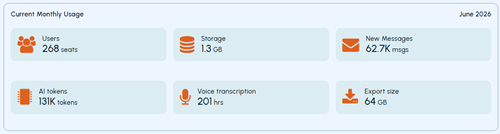
Component Description Users Displays the number of user seats recorded for the month. Storage Displays the amount of storage used for the month, in GB. New Messages Displays the number of new messages recorded for the month. AI tokens Displays the number of AI tokens consumed during the month. Voice transcription Displays the number of hours of voice transcription recorded during the month. Export size Displays the total size of exported data for the month, in GB. -
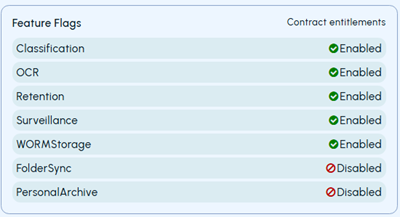
Contract entitlements: Displays the features included in the active contract and their current entitlement status whether it is Enabled or Disabled in contract.
-
Total Consumption chart: Displays the cumulative consumption units recorded over the contract period. It helps you review the growth in total consumption over time and compare recorded consumption with the projected consumption path.
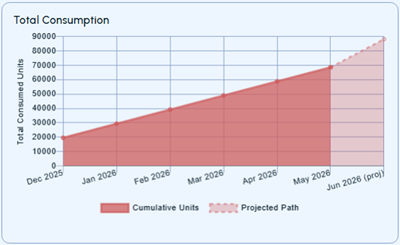
Chart element Description Total Consumed Units Represents the cumulative number of consumption units recorded up to each month. Cumulative Units Displays the recorded cumulative consumption as a solid shaded area. Projected Path Displays the projected cumulative consumption for a future period as a dotted shaded area. Month Identifies the month associated with each consumption value. A projected month is marked as projected on the horizontal axis. -
Monthly Usage by Category chart: Displays the consumption recorded for each usage category by month. It enables you to compare monthly consumption across categories and identify changes in usage over time. Each category is represented by a separate bar within the monthly group, allowing you to compare category-level consumption for the same month and review trends across the displayed period.
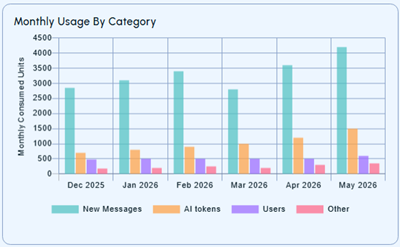
Chart element Description Monthly Consumed Units Represents the number of consumption units recorded for each category during a month. New Messages Displays the monthly consumption attributed to new messages. AI tokens Displays the monthly consumption attributed to AI token usage. Users Displays the monthly consumption attributed to users. Other Displays the combined monthly consumption attributed to categories that are not shown separately in the chart. Month Identifies the month associated with each set of category values. -
Monthly Consumption chart: Displays the total consumption units recorded for each month. It helps you compare monthly consumption over the displayed period and review the projected consumption for the upcoming month.
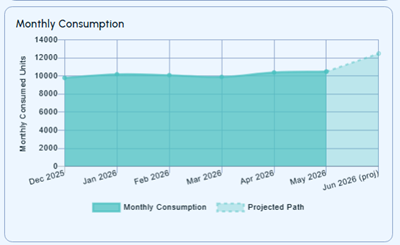
Chart element Description Monthly Consumed Units Represents the total number of consumption units recorded during each month. Monthly Consumption Displays the actual monthly consumption as a solid shaded area. Projected Path Displays the projected consumption for a future month as a dotted shaded area. Month Identifies the month associated with each consumption value. A projected month is marked as projected on the horizontal axis.
Related information